Since the early phase of the country modernization, the center of gravity of China’s economy has been alternately located in the coastal area (Blue China) and in inland area (Yellow China). Such a shift is now taking place in China’s economic geography: the interior regions are catching up the coastal area (which was the engine of economic takeoff the last thirty years), thanks to an outstanding convergence speed in industry. This rebalancing goes hand in hand with China’s new growth regime which relies increasingly on its expanding domestic market. The analysis is based on the data from the National Bureau of Statistics of the PRC: the statistical yearbooks provide the long term macroeconomic series at provincial level (1952-2011); the data from the census of industrial firms allow an in-depth analysis of the period 1997-2009, a period in which the manufacturing industry has played a leading role in the spectacular growth of the Chinese economy.
Related articles and documents :
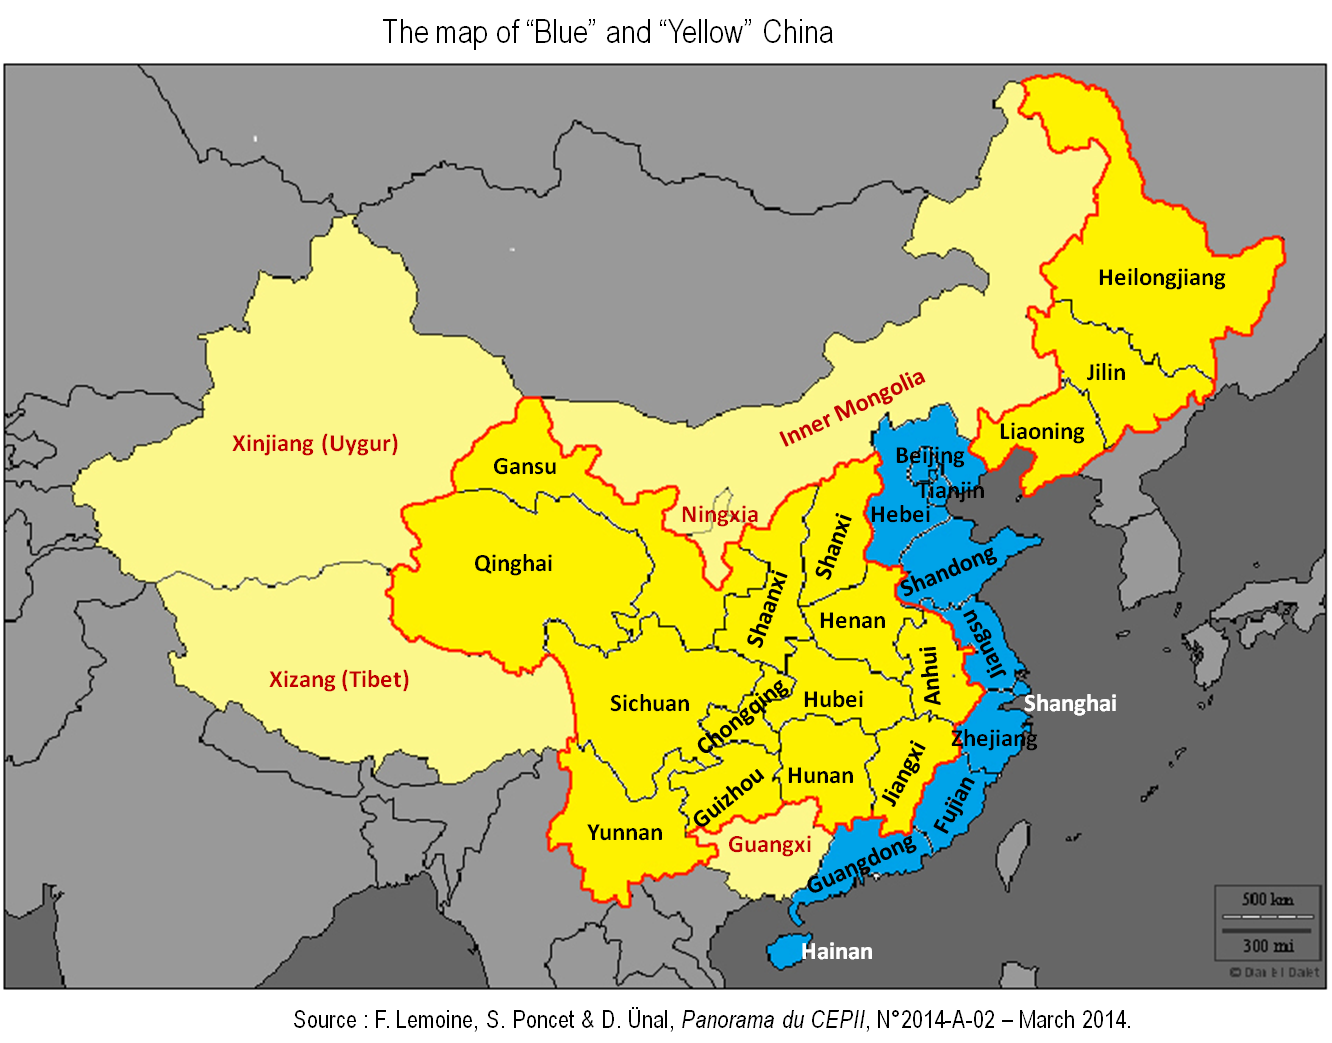
The map of “Blue” and “Yellow” China
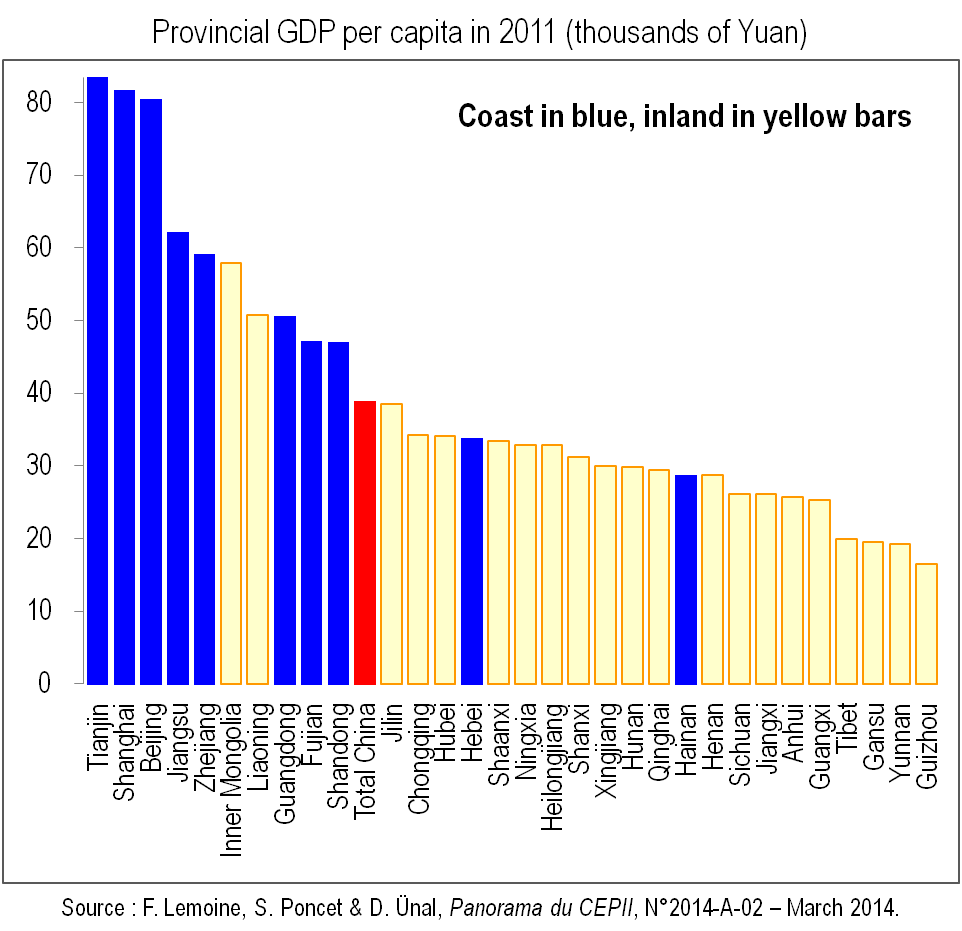
Figure 1. Provincial GDP per capita in 2011 (thousands of Yuan)
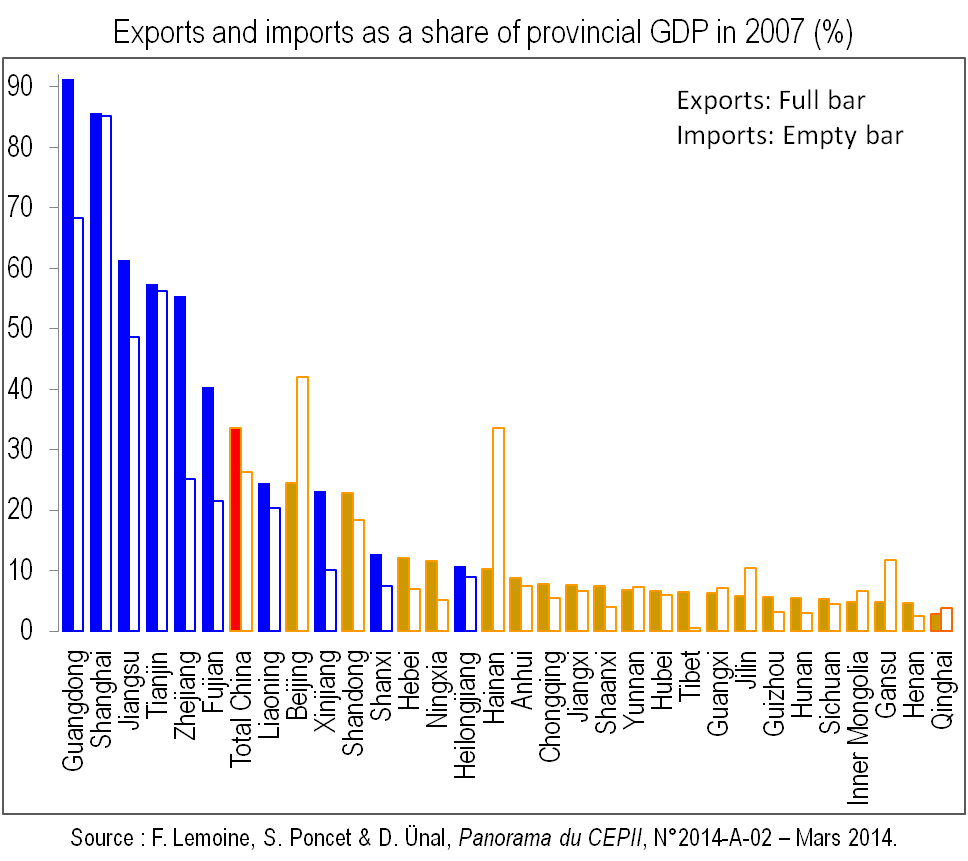
Figure 2. Exports and imports as a share of provincial GDP in 2007 (%)
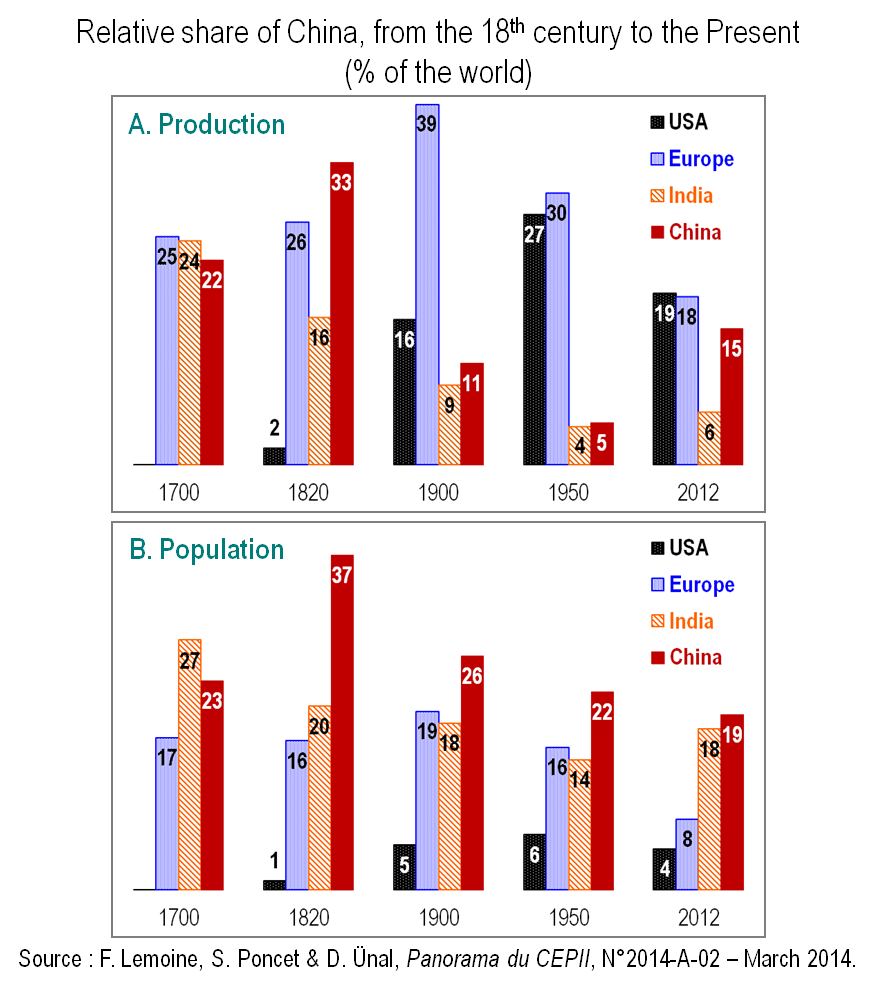
Figures 3. Relative share of China, from the 18th century to the Present: production and population in % of the world
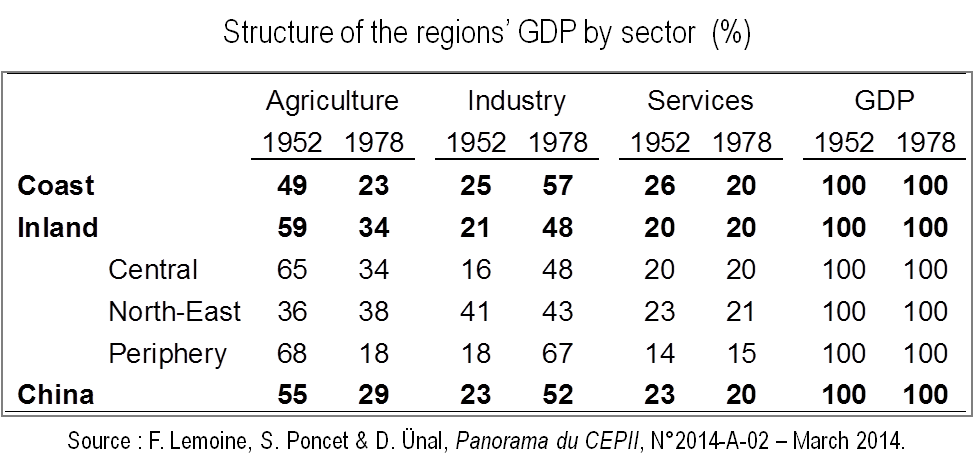
Table 1. Structure of the regions’ GDP by sector, 1952 and 1978 (%)
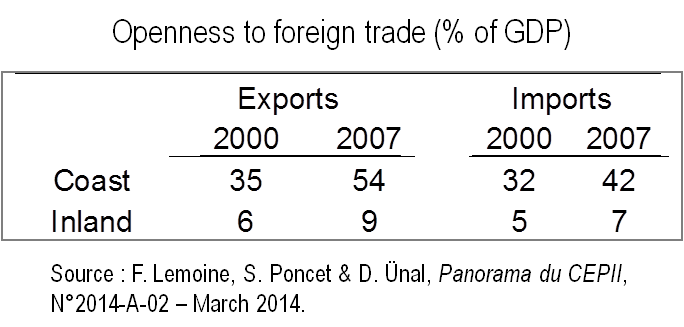
Table 2. Coast and inland region, openness to foreign trade in the 2000s (% of GDP)
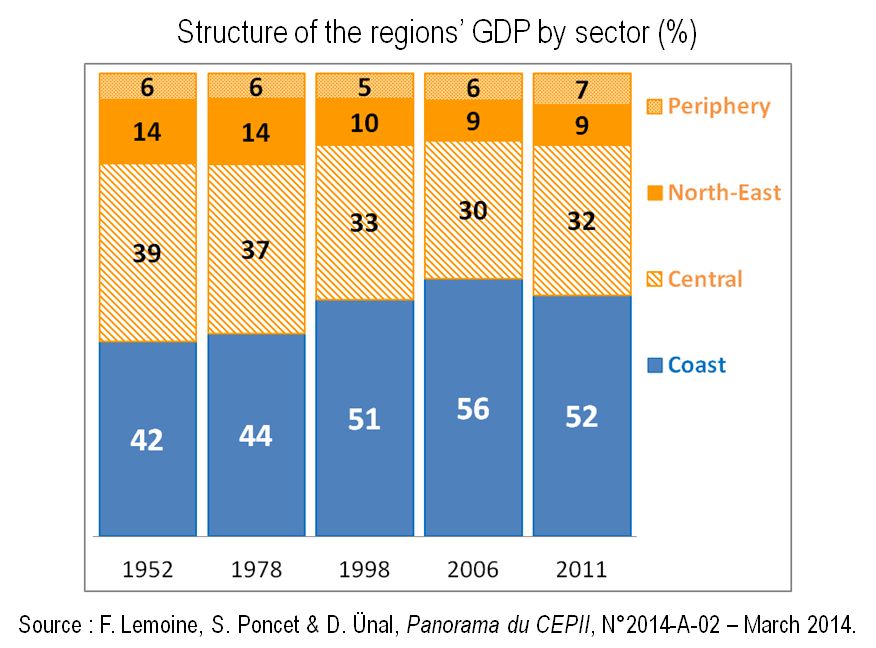
Figure 4. Regional distribution of China’s GDP, 1952-2011 (%)
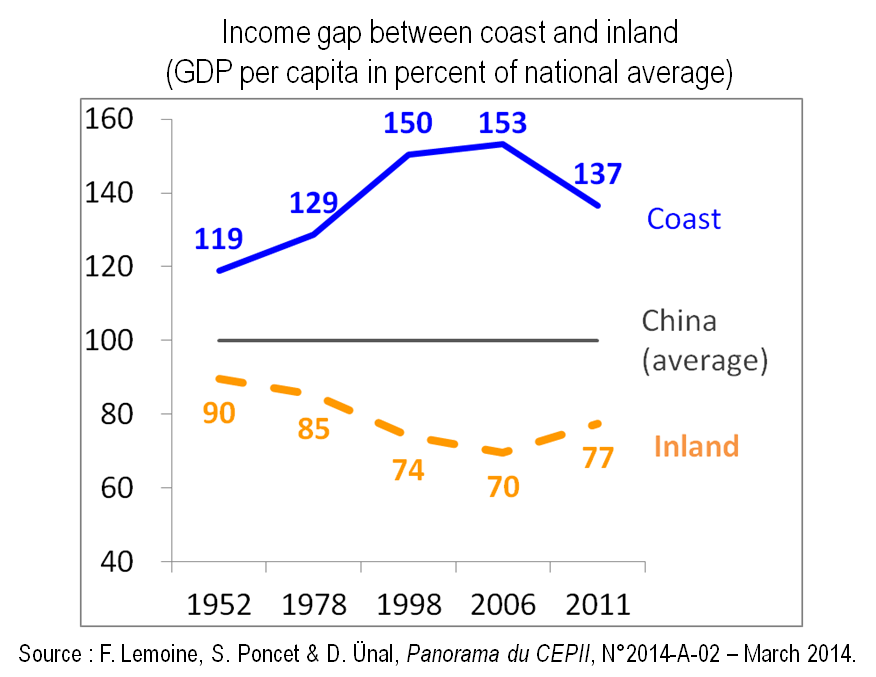
Figure 5. Income gap between coast and inland, 1952-2011 (GDP per capita in percent of national average)
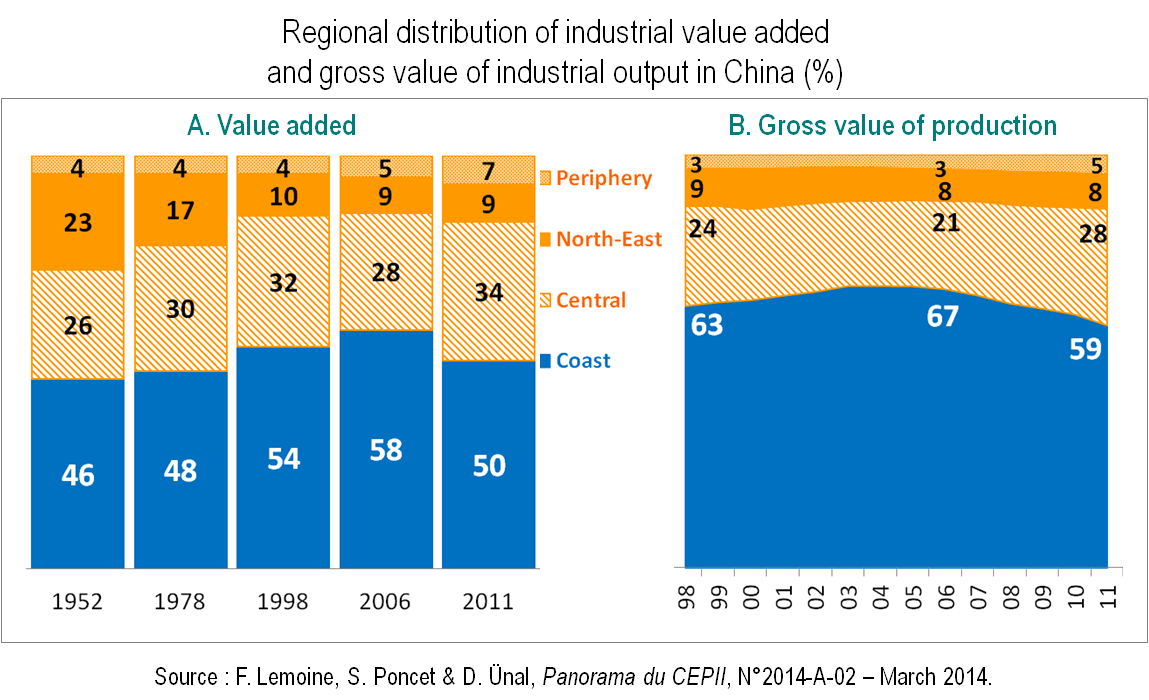
Figures 6. Regional distribution of industrial value added (1952-2011) and gross value of industrial output (1998-2011) in China (%)
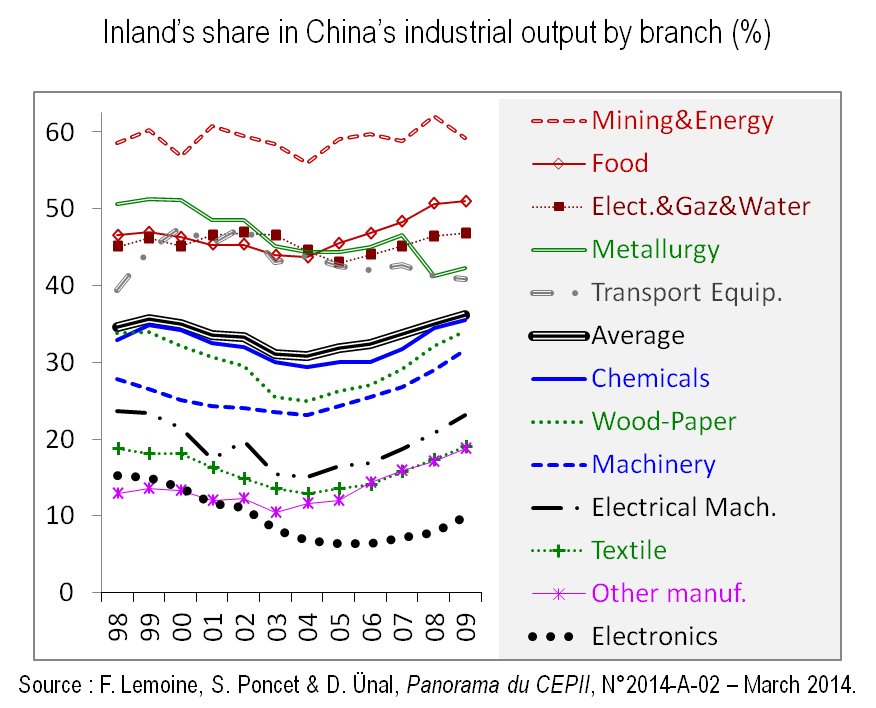
Figure 7. Inland’s share in China’s industrial output by branch, 1998-2009 (%)
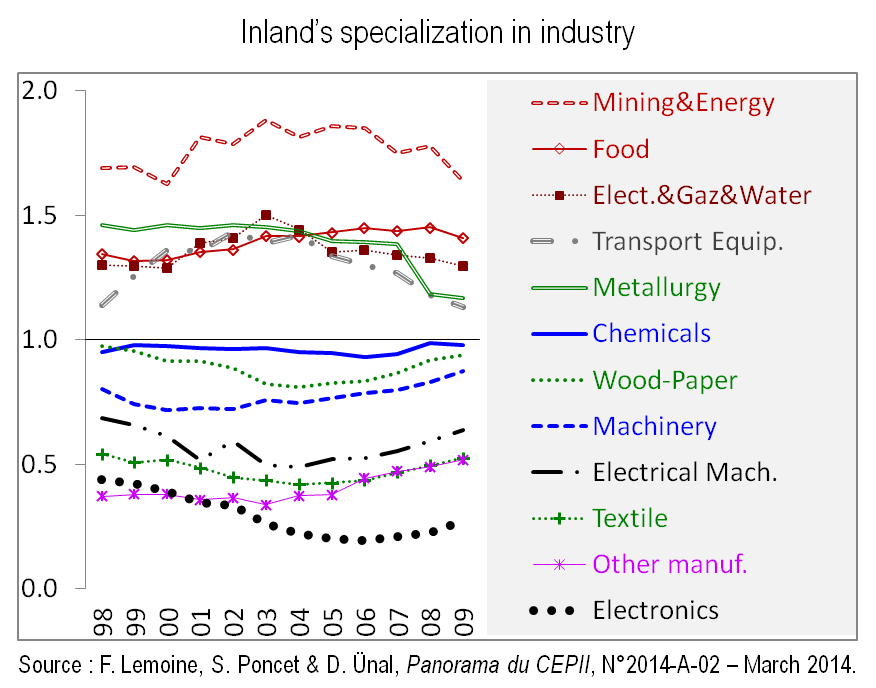
Figure 8. Inland’s specialization in industry, 1998-2009
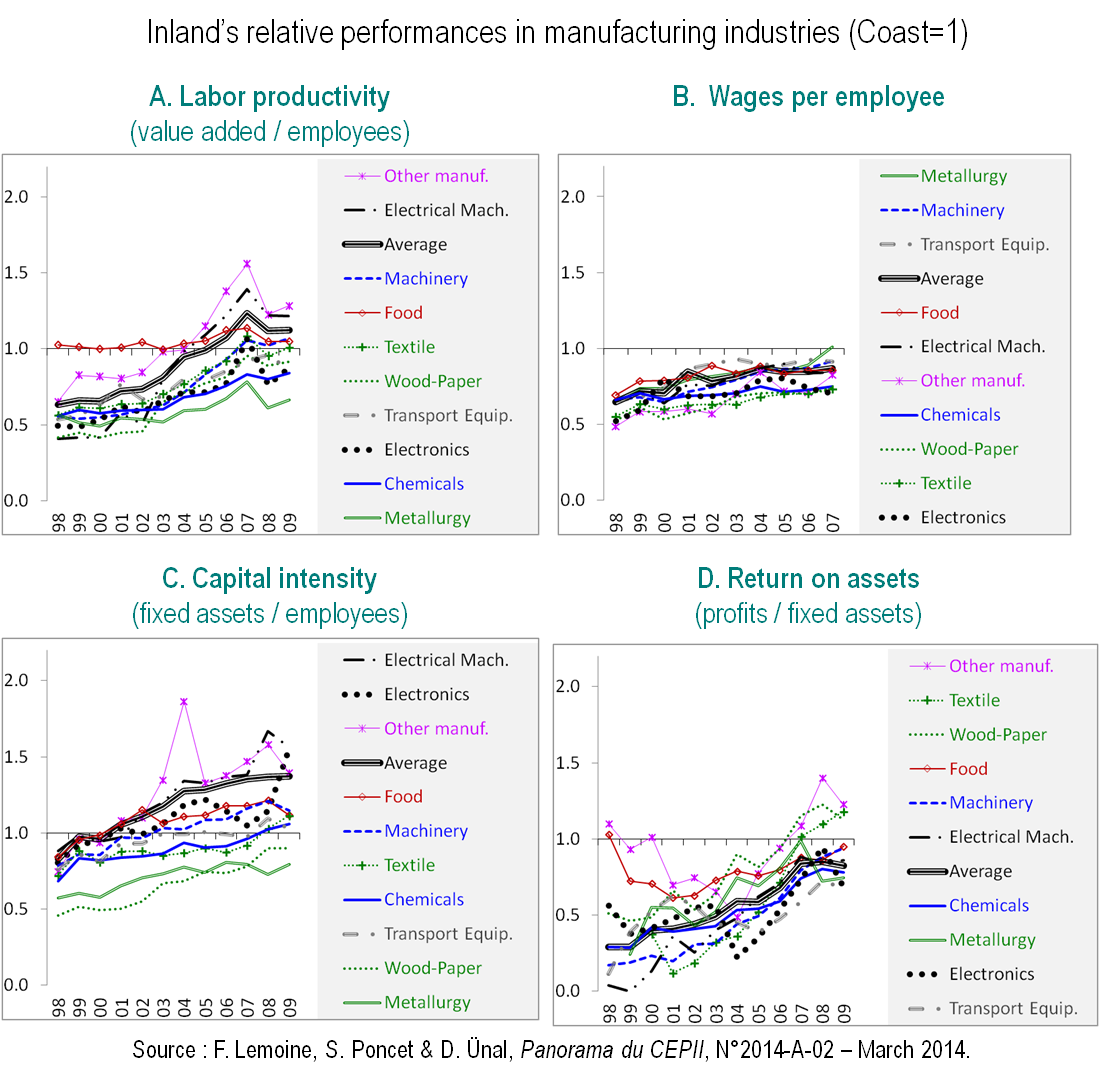
Figures 9. Inland’s relative performances in manufacturing industries: labor productivity, wages, capital intensity and return on assets (1998-2009, Coast=1)
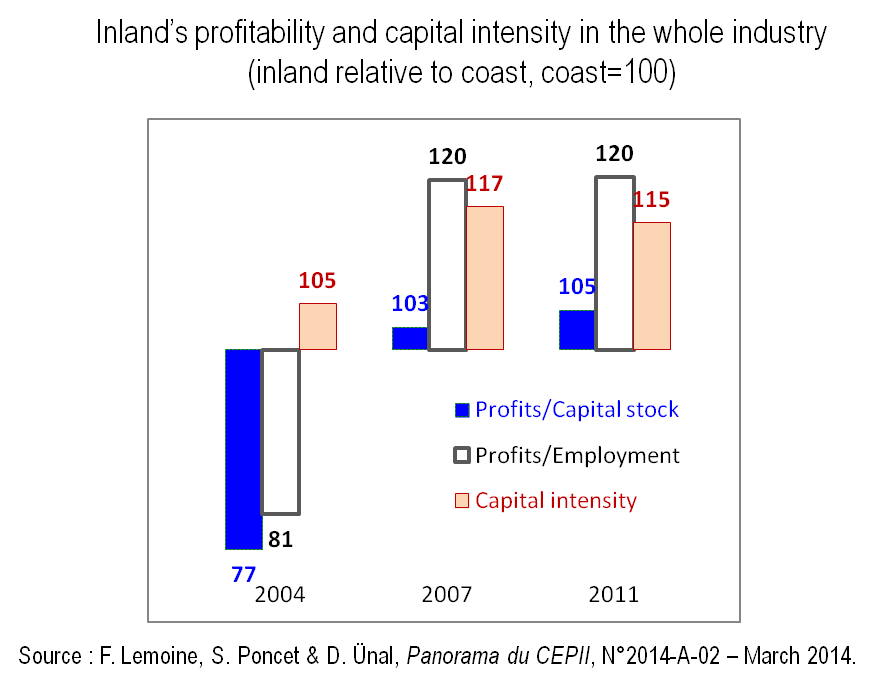
Figure 10. Inland’s profitability and capital intensity in the whole industry (2004, 2007, 2011, Coast=100)
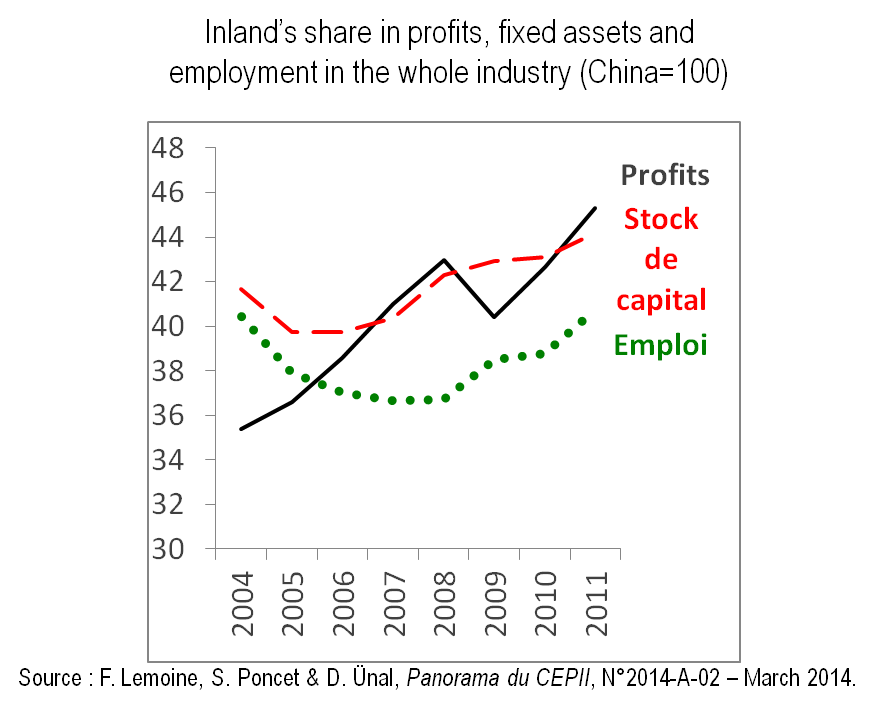
Figure 11. Inland’s share in profits, fixed assets and employment in the whole industry (2004-2011, China=100)
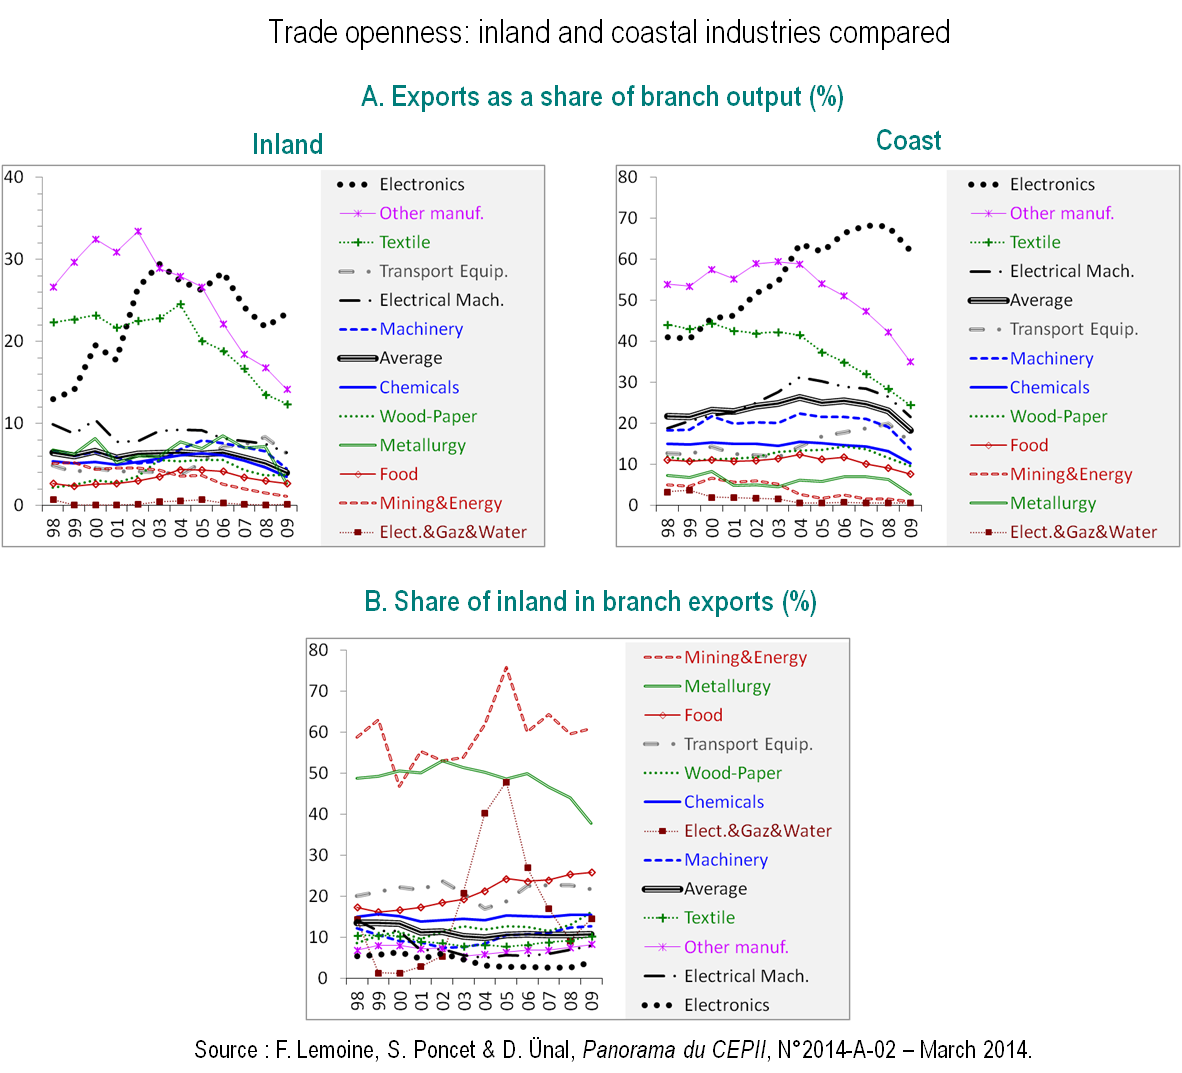
Figures 12. Trade openness (1998-2009, %)
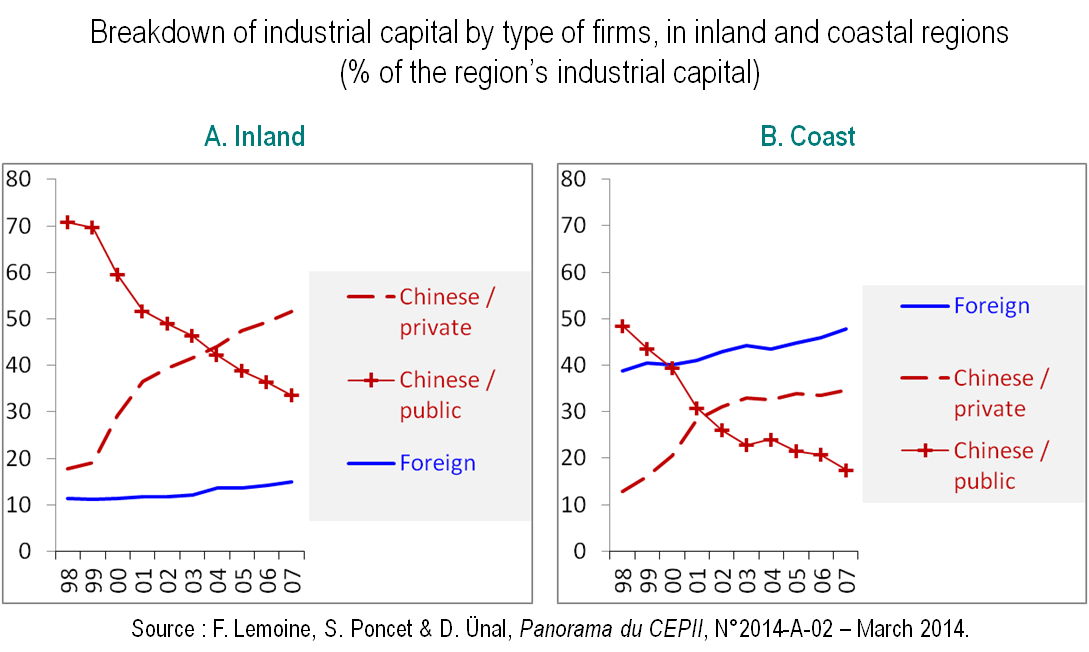
gures 13. Breakdown of industrial capital by type of firms, in inland and coastal regions (1998-2007, % of the region’s industrial capital)
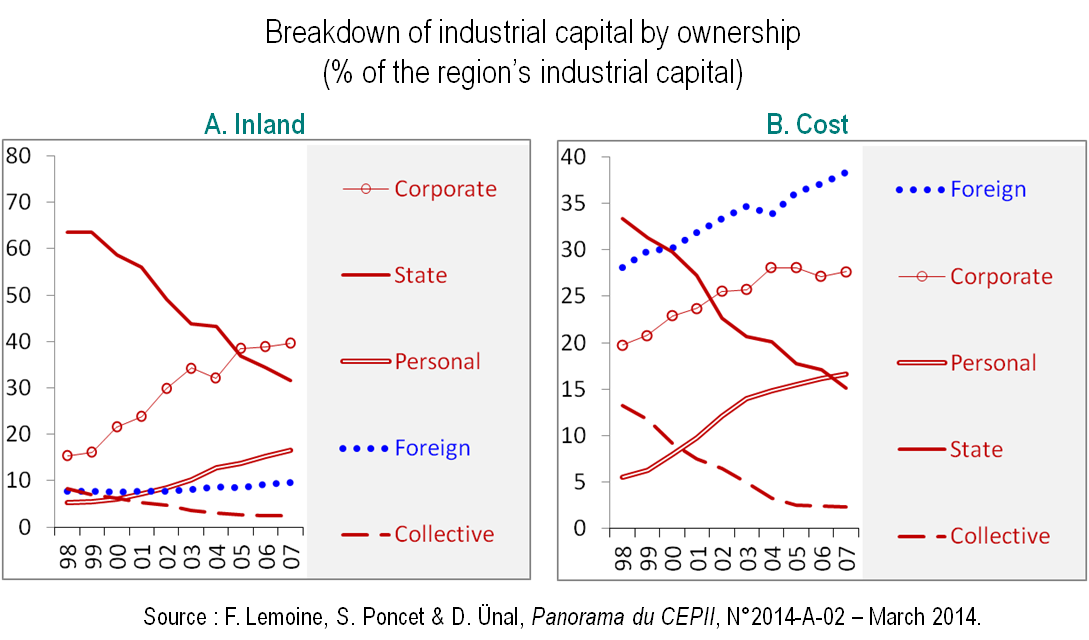
Figures 14. Breakdown of industrial capital by ownership, in inland and coastal regions (1998-2007, % of the region’s industrial capital)
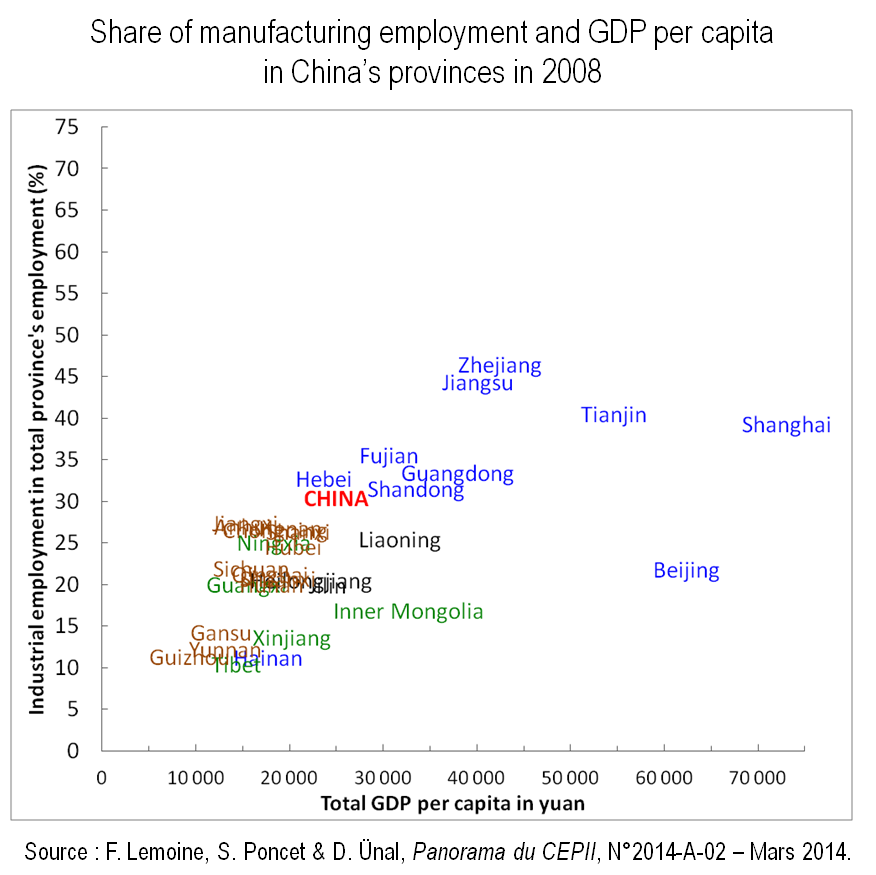
Figure 15. Share of manufacturing employment and GDP per capita in China’s provinces in 2008 (respectively in % and Yuan)
Related articles and documents :
![]() Panorama du CEPII
Panorama du CEPII
N°2014-02, mars 2014
![]() Full Text
Full Text ![]()
![]() Annexe
Annexe ![]()
![]() Reference
Reference
BibTeX (with abstract)
plain text (with abstract)
RIS (with abstract)
![]() Contact:
Contact:
Back


